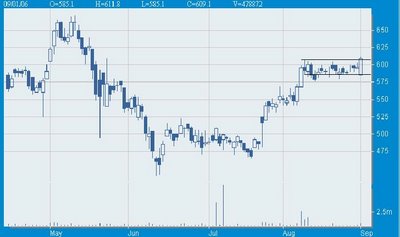
ICICI BANK (609.10)
A NICE PIECE OF CAKE...
(click on the charts for better view)
This stock consolidated in the form of bullish rectangle formation. Since 8/08 the stock consolidated within the range of 586 and 606. Is this stock about to complete the Rectangle formation. Lets wait and see. Go long in this stock with the stop loss of 582 which is the 61.8% fibo of 05/11 and 06/13 for the Target of 635-662 and 671. The most important thing is that it nicely laid the formation above the 61.8% fibo (582) as long as it stays above this level then it can test the all time high. This stock have a sloid support at 590-586 and 582. The ultimate stop loss is 582. As of now it will face the resistence of 612 (BB resistence) or not. It looks damn good on the charts for long...
A NICE PIECE OF CAKE...

(click on the charts for better view)
This stock consolidated in the form of bullish rectangle formation. Since 8/08 the stock consolidated within the range of 586 and 606. Is this stock about to complete the Rectangle formation. Lets wait and see. Go long in this stock with the stop loss of 582 which is the 61.8% fibo of 05/11 and 06/13 for the Target of 635-662 and 671. The most important thing is that it nicely laid the formation above the 61.8% fibo (582) as long as it stays above this level then it can test the all time high. This stock have a sloid support at 590-586 and 582. The ultimate stop loss is 582. As of now it will face the resistence of 612 (BB resistence) or not. It looks damn good on the charts for long...
posted by Naveen Pantera at 6:42 PM
![]()
![]()


<< Home