CAD/JPY 105.12
POSSIBLE RANGEBOUND

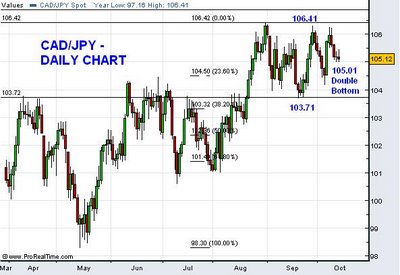
Now it is forming Rectangle formation between 106.42 to 103.71 on daily charts. The rally from the low of 98.31 to 106.42 is not completed yet, this 800 odd pips rally is valid as long as it stays above 103.32 which is 38.2% fibo support of 106.42-98.31 and 103.71 which is 9/20 low. Now in the last couple of trading days it formed Double Bottom formation, i feel this will take the price towards 106 levels. Daily RSI is just hovering above 50 mark and Daily Bollinger Band suggest that near term movement will be within the band of 106.42-103.71. Breakout above 106.42 i put my target at 109.10 and anything break below 103.71 it'll retrace the 800 odd pips rally and it take support at 101.44 which is 61.8% fibo support of 106.42-98.31. For further Loonie bull rally it need to take off the 106.41 levels, for that Crude need to support the Loonie.
POSSIBLE RANGEBOUND

Now it is forming Rectangle formation between 106.42 to 103.71 on daily charts. The rally from the low of 98.31 to 106.42 is not completed yet, this 800 odd pips rally is valid as long as it stays above 103.32 which is 38.2% fibo support of 106.42-98.31 and 103.71 which is 9/20 low. Now in the last couple of trading days it formed Double Bottom formation, i feel this will take the price towards 106 levels. Daily RSI is just hovering above 50 mark and Daily Bollinger Band suggest that near term movement will be within the band of 106.42-103.71. Breakout above 106.42 i put my target at 109.10 and anything break below 103.71 it'll retrace the 800 odd pips rally and it take support at 101.44 which is 61.8% fibo support of 106.42-98.31. For further Loonie bull rally it need to take off the 106.41 levels, for that Crude need to support the Loonie.


<< Home