HDFC BANK
POSSIBLE RANGEBOUND BETWEEN 1075 & 950...

Possibly this stock will struck in the range bound between 1075 and 950 in the near term. Ever since making the all time high of 1075 andretrace to 950 trading in rangebound with positive bias. Daily CCIis just heading towards the extremes and Daily CCI is still firm abovethe mid-point level. Above 1033 it'll test the 1075 and below 985 it'lltest the 950 level. My intermediate target is 1052-1200 levels. As per Waves still we're in the Wave 3. But still not confirmed that Wave 3is terminated or not.
POSSIBLE RANGEBOUND BETWEEN 1075 & 950...

Possibly this stock will struck in the range bound between 1075 and 950 in the near term. Ever since making the all time high of 1075 andretrace to 950 trading in rangebound with positive bias. Daily CCIis just heading towards the extremes and Daily CCI is still firm abovethe mid-point level. Above 1033 it'll test the 1075 and below 985 it'lltest the 950 level. My intermediate target is 1052-1200 levels. As per Waves still we're in the Wave 3. But still not confirmed that Wave 3is terminated or not.
ACC
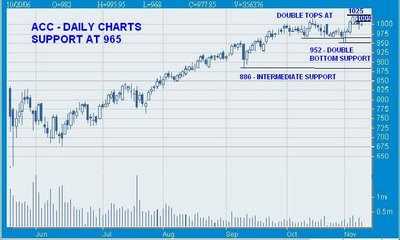
MAJOR TOP AT 1025

This stock formed Double Top at 1025 and made anothe rDouble Top at 1009. The support is at 987, below 987 it'll test the stronger supports like 966 and 952 and thereabout it'll test the 886 levels. The resistence for this stock is at 1070. Daily CCI is just below theextremes and Daily RSI is still above the mid-point level. Juat few trading session back this stock penetrated the Bollinger Band and nowtrading inside the band levels and this suggest it'll likely test thelower band of BB at 965. So watch out for the levels like 1025 and965-966.
MAJOR TOP AT 1025

This stock formed Double Top at 1025 and made anothe rDouble Top at 1009. The support is at 987, below 987 it'll test the stronger supports like 966 and 952 and thereabout it'll test the 886 levels. The resistence for this stock is at 1070. Daily CCI is just below theextremes and Daily RSI is still above the mid-point level. Juat few trading session back this stock penetrated the Bollinger Band and nowtrading inside the band levels and this suggest it'll likely test thelower band of BB at 965. So watch out for the levels like 1025 and965-966.
ICICI BANK
KISSED 800 MARK...

Still looks strong on the charts, almost near to 814 which is the 161.8% retrace of the fall from 671-440. Since kissing the 440 markin early June this stock rallied non-stop till now. The strong support is at 758. If it cracks the 814 mark then it'll find resistence at 852.
KISSED 800 MARK...

Still looks strong on the charts, almost near to 814 which is the 161.8% retrace of the fall from 671-440. Since kissing the 440 markin early June this stock rallied non-stop till now. The strong support is at 758. If it cracks the 814 mark then it'll find resistence at 852.


<< Home