TATA STEEL (501.75)
IN TORRID TIME...
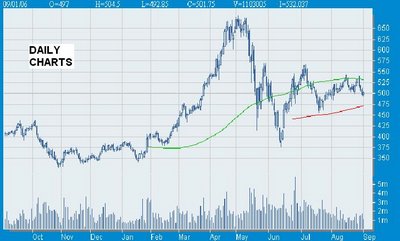
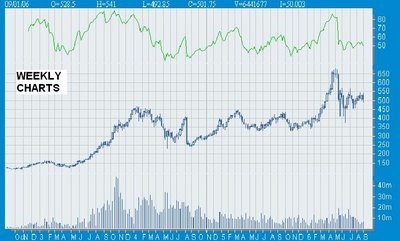
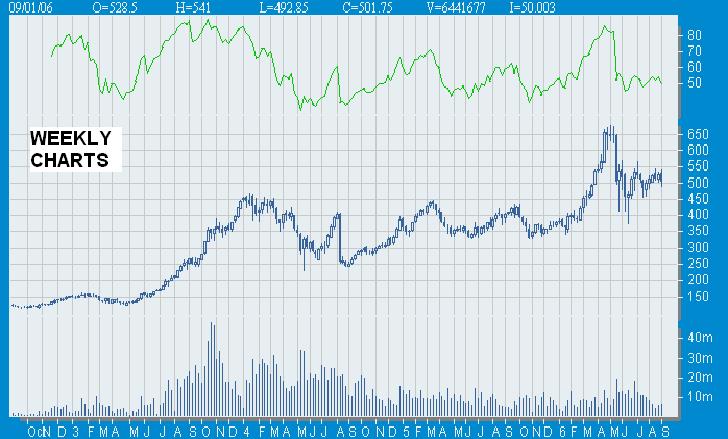
This stock is trading within the band of the 100dma and 200dma since mid-july. Resisting at 100dma band of 532 and supporting at 200dma band of 475. On Daily Charts the price is closed at the lower band of Bollinger Band. If it take the support over here it can move upto the level of 525-532. And even BB is getting somewhat narrower as the trading progresses. On Daily Charts you can see the 3 Black Crows formation, this formation suggest a bearish is ahead. It can take to the level of 475. Daily CCI is still below the -100 mark which suggest bearish sign. Daily MACD still showing sluggish. Daily RSI is still below the mid-point. On Weekly charts indicator the CCI is still trading below the 100 value and heading towards the mid-point value. RSI is just abve the 50 value. So i put this stock under "UNDERPERFORMER" or might it'll trade in rangebound...Above the 100dma target is beyond 600 and below the 200dma the target is at around 400...
IN TORRID TIME...

This stock is trading within the band of the 100dma and 200dma since mid-july. Resisting at 100dma band of 532 and supporting at 200dma band of 475. On Daily Charts the price is closed at the lower band of Bollinger Band. If it take the support over here it can move upto the level of 525-532. And even BB is getting somewhat narrower as the trading progresses. On Daily Charts you can see the 3 Black Crows formation, this formation suggest a bearish is ahead. It can take to the level of 475. Daily CCI is still below the -100 mark which suggest bearish sign. Daily MACD still showing sluggish. Daily RSI is still below the mid-point. On Weekly charts indicator the CCI is still trading below the 100 value and heading towards the mid-point value. RSI is just abve the 50 value. So i put this stock under "UNDERPERFORMER" or might it'll trade in rangebound...Above the 100dma target is beyond 600 and below the 200dma the target is at around 400...
posted by Naveen Pantera at 2:13 PM
![]()
![]()


<< Home