THE FX MAJORS :
EUR/USD-USD/JPY-GBP/USD-USD/CHF
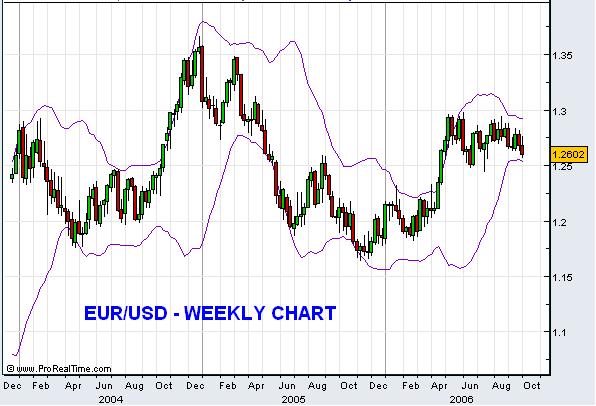
EUR/USD 1.2602

The medium uptrend from 1.1640 has already made an important top at 1.2980 and price actions from there represent a larger scale consolidation to this whole medium term rise. Hence it closed below the crucial support of 1.2630 and now it might try to penetrate the 100dma level at 1.2515 and now its is looking likely. The rally from 1.1640 to 1.2980 is still not over as long as it stays above 1.2469. But once move down the 1.2469 level then it'll retrace the rally of 1340 pips. But it retraced the fall rally from 1.3666 to 1.1640. Now it trading below the 1.2650 which is 50% of 1.3666-1.1640. In the larger picture it'll likley try to consolidate between 1.2980-1.2449. The lower band of Bollinger Band level is at 1.2534
USD/JPY 119.01


This pair touched as high as 1.2635, breaking marginally above mentioned 1.2594/1.2620 cluster resistance. And even it spiked the Triangle on intra-day basis. In the bigger picture, USD/CHF's whole fall from 1.3287 has completed at 1.1945 already and subsequent rebound from 1.1919 to 1.2594 represents part of a larger consolidation. Firm break above 1.2612/23. Now it closed at 1.2615 which is 50% of 1.3287-1.1945 now it try to eliminate medium term bearishness and indicates a stronger medium term rise is underway towards 61.8% retracement at 1.2773 first. We'll hold on to this view as long as USD/CHF stays above 1.2457 support. However, a break below 1.2457 will indicate last week's break was another false break. In such case, USD/CHF is still considered in sideway trading and could retest 1.2182 cluster support (61.8% retracement of 1.1945 to 1.2594 at 1.2192) again. Now it closed at the top band of the Bollinger Band and Weekly RSI is moved over the mid-point level. I feel technically next week i'm bullish on this counter. In case if it keep resisting the 1.2612/23 then it'll trade in the range bound and try to complete the bullish triangle formation.
EUR/USD-USD/JPY-GBP/USD-USD/CHF
EUR/USD 1.2602
The medium uptrend from 1.1640 has already made an important top at 1.2980 and price actions from there represent a larger scale consolidation to this whole medium term rise. Hence it closed below the crucial support of 1.2630 and now it might try to penetrate the 100dma level at 1.2515 and now its is looking likely. The rally from 1.1640 to 1.2980 is still not over as long as it stays above 1.2469. But once move down the 1.2469 level then it'll retrace the rally of 1340 pips. But it retraced the fall rally from 1.3666 to 1.1640. Now it trading below the 1.2650 which is 50% of 1.3666-1.1640. In the larger picture it'll likley try to consolidate between 1.2980-1.2449. The lower band of Bollinger Band level is at 1.2534
USD/JPY 119.01
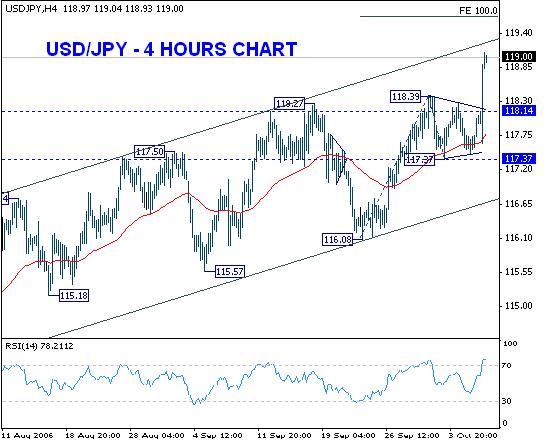
Following broad based dollar strength, USD/JPY rose sharply last Friday, breaking through mentioned 118.88 resistance. More importantly, it's has now broken through multi-year trend line resistance (147.68 to 135.20 then to 121.38, now at 118.42 level). The strong medium term rise from 108.99 could either be resumption of the year long up trend from 101.65 to 121.38, in other words, the correction from 121.38 has totally finished at 108.99 already. Or it could just be part of the consolidation that started at 121.38. But in either case, a retest of 121.38 high should be seen. We'll hold on to this view as long as USD/JPY stays above the current inner rising channel (lower channel at 116.74 now). On the downside, break of the current inner channel will argue that the rise from 113.95 has completed and turn focus back to the lower side of the outer channel (now at 115.22). This will also be the first alert that medium term rise from 108.99 could have finished.
GBP/USD 1.8705
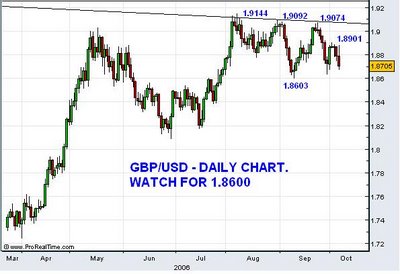
Cables level of 1.8600 is still not secured an currently trading just above the 100 pips of 1.8600 level. 1.8603 is the level where it rebound from the high of 1.9092. And then it made another high of 1.9074. Cable is unable to stay frim above the 1.9000 levels. Now the crucial support lies at 1.8641 which is the lower band of Bollinger Band. Before it touch the lower band it has to breach the 100dma is at 1.8686. Anything slips below 1.8546 then it'll retest the level of 1.8177. As of now as long as it stays below 1.8900 more the downside is set.
USD/CHF 1.2601

This pair touched as high as 1.2635, breaking marginally above mentioned 1.2594/1.2620 cluster resistance. And even it spiked the Triangle on intra-day basis. In the bigger picture, USD/CHF's whole fall from 1.3287 has completed at 1.1945 already and subsequent rebound from 1.1919 to 1.2594 represents part of a larger consolidation. Firm break above 1.2612/23. Now it closed at 1.2615 which is 50% of 1.3287-1.1945 now it try to eliminate medium term bearishness and indicates a stronger medium term rise is underway towards 61.8% retracement at 1.2773 first. We'll hold on to this view as long as USD/CHF stays above 1.2457 support. However, a break below 1.2457 will indicate last week's break was another false break. In such case, USD/CHF is still considered in sideway trading and could retest 1.2182 cluster support (61.8% retracement of 1.1945 to 1.2594 at 1.2192) again. Now it closed at the top band of the Bollinger Band and Weekly RSI is moved over the mid-point level. I feel technically next week i'm bullish on this counter. In case if it keep resisting the 1.2612/23 then it'll trade in the range bound and try to complete the bullish triangle formation.
posted by Naveen Pantera at 6:30 PM
![]()
![]()


<< Home