HINDALCO 172.55
A CHOPPY ALUMINIUM...

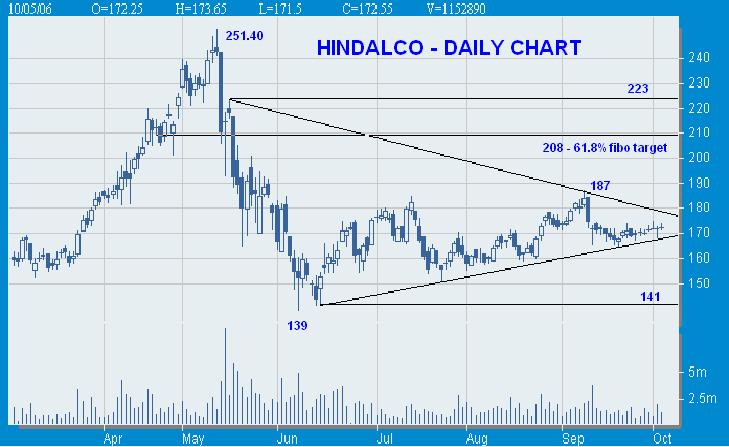
This stock is trading a very choppy since mid-september. On daily charts it is completing the Triangle pattern. As long as it stays below 182 which is 38.2% fibo resistence of 251.4-139 then 139-141 is on the cards. Only above 182 will try to retrace the fall from 251.4 to 139. It means the fall from 251.4 to 139 is not over yet. It'll confirm when it sustain above 182. Above 182 it'll test the key levels of 195 and 208. If it breakdown from the triangle pattern then it'll try to retest the level of 139-141. And breakout from the triangle then it'll retrace the 100 bucks fall. Day by day the BB is getting narrower. Daily CCI is at extreme bullish, daily RSI is above the mid-point level, Momentum is slowly gathering the real momentum. All indicators that i mentioed are well and ok.
A CHOPPY ALUMINIUM...
This stock is trading a very choppy since mid-september. On daily charts it is completing the Triangle pattern. As long as it stays below 182 which is 38.2% fibo resistence of 251.4-139 then 139-141 is on the cards. Only above 182 will try to retrace the fall from 251.4 to 139. It means the fall from 251.4 to 139 is not over yet. It'll confirm when it sustain above 182. Above 182 it'll test the key levels of 195 and 208. If it breakdown from the triangle pattern then it'll try to retest the level of 139-141. And breakout from the triangle then it'll retrace the 100 bucks fall. Day by day the BB is getting narrower. Daily CCI is at extreme bullish, daily RSI is above the mid-point level, Momentum is slowly gathering the real momentum. All indicators that i mentioed are well and ok.
posted by Naveen Pantera at 9:34 PM
![]()
![]()


<< Home