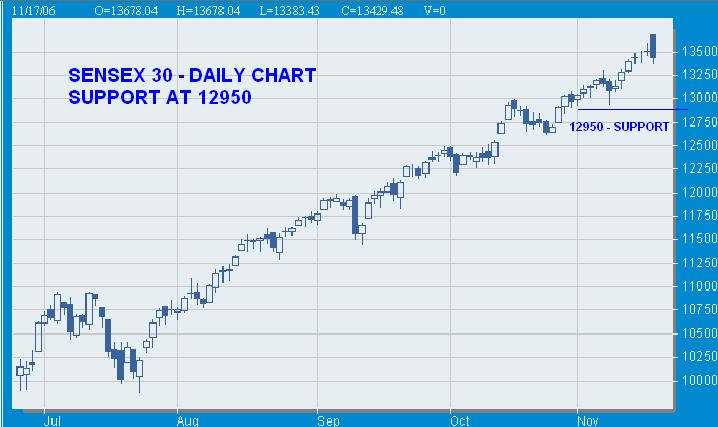
SENSEX 30
LOOKS BLEAK, SUPPORT AT 12950
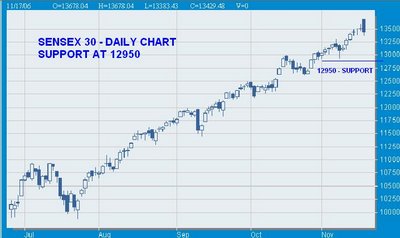
finally we got something to see to end this marathon rally fromlow of 9875. I feel Wave 3 of wave 5 is getting ready to truncated.If the Sensex breaks the 13383 then it'll test the 12950 level and even it can test the 12300 levels also. RSI is encouraging the fall.Here i would like to suggest for every long position holders just keep your eyes on 13383 level.
This stock retraced a little bit after resisting at 255 levels. SinceSeptember this stock is consolidating between 260 and 220 levels.And now its heading towards to retest the 220 levels. This stock isretraced 61.8% of the fall from 296 to 180 levels. As of now thisstock is unable to sustain above the 251 which is the 61.8% resistenceof the fall from 296-180. And the support comes at 224 which is the38.2% support of the 296-180 fall. The closed just below its 200dma,anything below this it'll lead to the 220 levels and might be even lower levels. Daily CCI is heading towards Extreme bearish zone. DailyRSI already below the mid-point level. So CCI, RSI, MACD and ROC are giving SELL signal which clearly tells the story of 220 levels.
Really it looks very bleak in point of technical. As it keepsresisting at 9 month bear trendline and now testing its 200dma whichis at 736. If 200dma cracks then we see more lower levels. If it takes support at 1736 then upside will be very limited. In the comingmonths we'll see the lower levels of 625. Even 636 is very crucialjust bcoz 636 is lower band of BB and some of the leading indicatorspointing bearishness, means 200dma is not sustainable one.
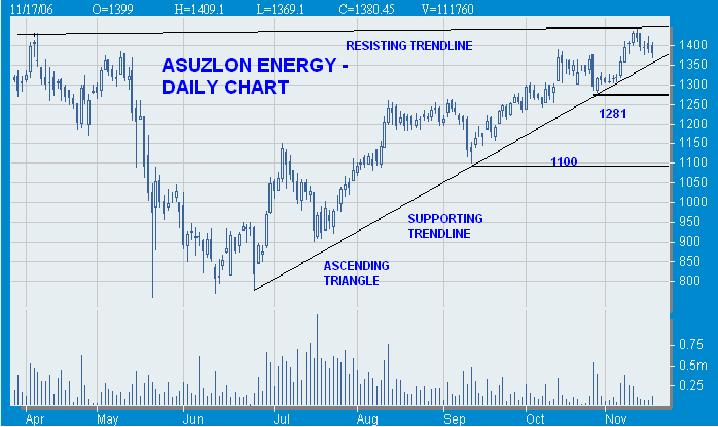
SUZLON ENERGY
TECHNICAL ENERGY IS STILL INTACT...BUT RISK...
This stock made the 8 month Bear trendline which is connected thehighs of 1429.95 and 1432 (04/07 and 11/14). And now heading to testthe 5 month bull trendline which is connected the lows of 778-11011281 and 1308 but never tried to penetrate the supporting trend line.In the larger picture we're seeing triangle formation and its about tocomplete the formation. If it breaks the supporting trendline then itwill test the level of 1281 and 1100. If the stock gets upper triggerthen i put my resistence at 1680 and my long term target will be 2050.
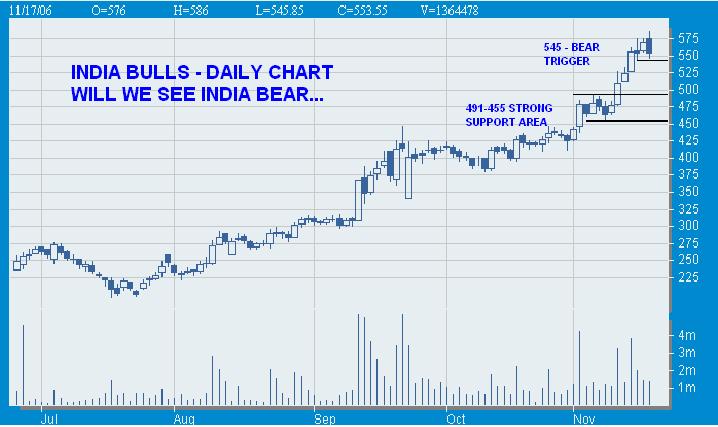
INDIA BULLS
CAN WE SEE SOME INDIA BEAR...

Sell this stock as it takes off the level of 545. Some of the leadingindicators pointing towards that. This stock formed Bearish Engulfingpattern on Daily Charts. If the 545 is triggered then it find supportat 490-455 levels. Or even we can see the level of 375 but thats too far away and lets keep our eye on the levels of 545 and 490-455 leevl.
LOOKS BLEAK, SUPPORT AT 12950
finally we got something to see to end this marathon rally fromlow of 9875. I feel Wave 3 of wave 5 is getting ready to truncated.If the Sensex breaks the 13383 then it'll test the 12950 level and even it can test the 12300 levels also. RSI is encouraging the fall.Here i would like to suggest for every long position holders just keep your eyes on 13383 level.
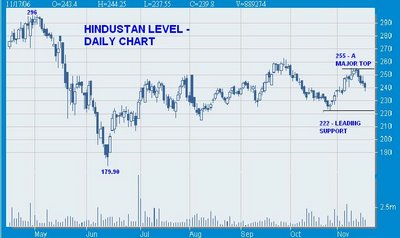
HINDUSTAN LEVER
A MAJOR TOP AT 255

This stock retraced a little bit after resisting at 255 levels. SinceSeptember this stock is consolidating between 260 and 220 levels.And now its heading towards to retest the 220 levels. This stock isretraced 61.8% of the fall from 296 to 180 levels. As of now thisstock is unable to sustain above the 251 which is the 61.8% resistenceof the fall from 296-180. And the support comes at 224 which is the38.2% support of the 296-180 fall. The closed just below its 200dma,anything below this it'll lead to the 220 levels and might be even lower levels. Daily CCI is heading towards Extreme bearish zone. DailyRSI already below the mid-point level. So CCI, RSI, MACD and ROC are giving SELL signal which clearly tells the story of 220 levels.
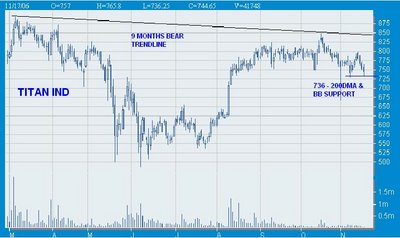
TITAN IND
TESTING ITS 200DMA
TESTING ITS 200DMA

Really it looks very bleak in point of technical. As it keepsresisting at 9 month bear trendline and now testing its 200dma whichis at 736. If 200dma cracks then we see more lower levels. If it takes support at 1736 then upside will be very limited. In the comingmonths we'll see the lower levels of 625. Even 636 is very crucialjust bcoz 636 is lower band of BB and some of the leading indicatorspointing bearishness, means 200dma is not sustainable one.
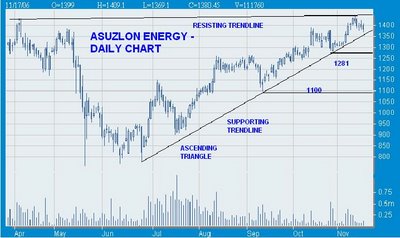
SUZLON ENERGY
TECHNICAL ENERGY IS STILL INTACT...BUT RISK...
This stock made the 8 month Bear trendline which is connected thehighs of 1429.95 and 1432 (04/07 and 11/14). And now heading to testthe 5 month bull trendline which is connected the lows of 778-11011281 and 1308 but never tried to penetrate the supporting trend line.In the larger picture we're seeing triangle formation and its about tocomplete the formation. If it breaks the supporting trendline then itwill test the level of 1281 and 1100. If the stock gets upper triggerthen i put my resistence at 1680 and my long term target will be 2050.
INDIA BULLS
CAN WE SEE SOME INDIA BEAR...
Sell this stock as it takes off the level of 545. Some of the leadingindicators pointing towards that. This stock formed Bearish Engulfingpattern on Daily Charts. If the 545 is triggered then it find supportat 490-455 levels. Or even we can see the level of 375 but thats too far away and lets keep our eye on the levels of 545 and 490-455 leevl.
posted by Naveen Pantera at 9:25 PM
![]()
![]()


<< Home