Saturday, December 30, 2006

BALRAMPUR CHINI
A FALLING WEDGE PATTERN


I'm fairly bullish on this sugar stock, the fall from 205 is still not over and trading below the 100 mark. Currently this is forming a Falling Wedge formation. Now i'm slightly bullish on it and in the medium term i expect the price of 120-125 levels.
MRPL
STILL HANGING AROUND...


In the last 4 months MRPL is resisting thru the Bear trendline, now its just shy of surpassing the 50 and 200DMA resistence line which is at 41 and if it once crosses the 41 then next hurdles comes at 42 which is the 4 month Bear trendline. If it dont cross the 41 and 42 then further weakness will be there. The fall from 63.50 to 30 is not over yet, as it suggest the ongoing emerging Downward sloping channel is still the part of the rally of the fall from 63.50-30. Since the great fall MRPL never tried to retrace the rally, it failed to sustain above the 42.60 which is 38.2% fibo resistence of 63.50-30. As long as it dont cross the 42.60 then the low of 30 is valid one. Once move above the 42.6 will try to correct the great fall upto 50 level. Longer term indicator like RSI is still trading just below mid-point level as CCI too. And the Bollinger Band is getting narrower as week past, suggesting a huge price movement either side is expected after absorbing the volatality. Below 36.60 then only it lead to 30.

Thursday, December 28, 2006

PUNJAB TRACTORS
A BREAKOUT EXPECTED


Now this stock is back to break the 260 barrier, which is resisting for quite some time and never tried to breakout. Buy this stock if it breaks the 260 level or else it will take one more reversal. In the last 3 to 4 months it consolidated between 260 and 220. Once 260 breakout expected then this stock will kiss 300 level.
GAIL
STRONG ONLY ABOVE 270-280...


In the last 4 months this stock consolidated between 270 and 250. This stock will show strength only passing above the 270 and 280. If once crosses this level without violating the 262-258 level then we can see the level of 325. 262-258 level is the 50-100-200DMA prices. 280 is the 61.8% fibo resistence of the fall from 325 to 210. Since the fall from that level it never penetrated since then. The good thing is that its trading above the key MA lines and indicators like BB, CCI and RSI are all given BUY signal. Just wait for the breakout.
INDUSIND BANK
A HUGE BREAKOUT EXPECTED


Now this stock is shy away of the critical resistence. In this banking stock i'm expecting a huge breakout after the consolidation of nearly 5 months between 50 and 40 after the huge fall from 64.25 to the low of 27.30. Now 50 is the heavy resistence for this stock. 50 which is the 61.8% fibo resistence of the fall from 64.25-27.30 and the highs of September and December (in chart u can see the straight resistence line) and the 8 month Bear trendline which is connected the highs of 64.25 and 50.40. Once we saw the breakout from 50 then tis stock will kiss the 64. Buy only after the breakout. The strong support comes at 45 which is the 50DMA, 100DMA and 200DMA support. My faviurite indicators like CCI, RSI and BB all are showing buying strength in this counter.

Wednesday, December 27, 2006

HDFC BANK (revisiting)
ABOVE 1062 TARGET 1130


This stock is quite interesting and to say this one of my favourite counter. Well if this stock closed above 1062 then it'll kiss my target of 1125-1130. Daily RSI and CCI all are given BUY signal and now i'm waiting for BUY signal from BB for that it need to crack the 1062 mark. This stock made strong bottom at 1000 levels. Now this stock if forming Descending Triangle pattern.
ICICI BANK (revisiting)
A BREAKOUT FROM STRONG RESISTENCE


Finally we seen the breakout from 890 and closed above that level, now its heading for beyond 925 and most probably the level of 1005. Now the will this stock stay above the 890 if it so then above mentioned target are quite achievable even some most relaible indicators are indicating for further rally ha beyond 925. And todays 890 breakout is just a fluke then it'll get back to the levels of 835.
TATA MOTORS (revisiting)
A BREAKOUT FROM TRIANGLE, TARGET 1K


Today this stock made the breakout from the Triangle pattern, as i say a breakout from the 8 month old resisting line. Now this stock will set the stage to kiss the 1000 mark. All indicators favouring the Bull. The first resistence comes at 920 and then straight away to 1000. The support comes at 865 and 848.

Tuesday, December 26, 2006

SENSEX 30
TARGET 14150


Now market really looks good and setting all the stages to fire the all cylinders, and most probably the Bulls are now pulling up thier socks. BB giving BUY signals as CCI is too confirmed the BUY signal even RSI too happy with the BUY signal but RSI is now waiting to breakout from 13748 to given furhter strong BUY signal. BB suggesting the Sensex target at 14100-14150 in the coming days. Support is at 13585-13362, 13182 and 12801.
ITC
STILL BLEAKY, STRONG RESISTENCE AT 183-184


This stock is still looking weak, the stock will show its real strength when it moves above 183-184 level untill then 167 will be the key support for this stock. Anthing below that this stock will find support at 160 and 140 levels. Once it crosses its 50 & 200DMA resistence (183-184) the target will be 190-195 and then 212. Those who are long in this stock one can place a stop loss at 167 and the one who are short in this stock they place thier stop loss at 184 and move above the 183-184 just reverse your position.
BHEL
POSSIBLE TARGET 2500...


In this month of December BHEL formed a 3 wave corrective wave pattern, the fall from 2668 to 2333 is the Wave A and from 2333 to 2528 is correction of the fall from 2668-2333 is Wave B and the fall from 2528 to 2232 is the Wave C. And i feel that Wave C is terminated at 2232 if it so then i put my target for this stock at 2500. Daily CCI is giving buy signal, the very strong support for this stock is 2155 which is the 200DMA. And the worst thing for this stock is that it is still trading below its 6 month supporting trendline, as long as it dont cross the supporting trendline then 2232 and 2150 will be tested.
GATEWAY DISTRIPARKS LTD
A STRONG BREAKOUT...


This stocked move above and closed above its 200DMA which is at 193 and it penetrated its 1 year old Bear trendline. And most possibly a breakout from the triangle pattern. Immediate resistence is at 230 which is high of July. And thereafter it'l find the resistence at 267 and at 300. And the support comes at 193 and 177. As we see the breakout from the year old resistence line today, first let see whether is it just fluke or a genuine breakout. Afterall we're at the 6 month high.
NTPC
DOUBLE BOTTOM AT 131.50/65


This stock dropped very sharply from 155 to 131.50 and then we saw the 61.8% retracement of that fall and then back to form the Double Bottom and more important thing is that still very firm above the 200DMA. Now closed at 137 which is the 50DMA, if this stock resisted at 137 then possibly 131.50/65 will be violated, but i dont think that will happen as Daily CCi is giving Buy signal and place a strict stop loss at 131.50/65. The next key resistence for this stock comes at 137 and 147 when 147 crosses then it'll get more steam in it.

Saturday, December 23, 2006

RELIANCE INDUSTRIES
A CLOSE ABOVE 1250


Still this stock is trading above its 50DMA, recently it penetrated and suddenly it get back above the 50DMA support. Now the resistence comes at 1275, if 1275 takes-off then in no time we'll see 1300 mark and then thereafter 1350. For all the longs place a stop loss at 50DMA price. Anything below 50DMA it'll tests the level of 1230 and 1181.
TATA MOTORS
NEARING THE 8 MONTH BEAR TRENDLINE...


Now this stock is inching closer to the 8 month Bear trendline, and once the trendline breakout occurs then we can see a huge upmove in this counter and the target will be beyond 1000. Currently breakout price ia at 885. And followed by 6 month supporting trendline and at the end this stock is forming the triangle formation. If it resist the upper trendline once again then it'll test supporting trendline. And the key is that, this stock has still time left in it to complete the triangle formations. Yesterday this stock closed above the 847 which is 50DMA and 840 which is 200DMA, if it keep sustaining above the 840-847 level then we can see the early breakout from the triangle and testing the 1000 mark. Daily CCI is just above the mid-point level and Daily RSI is also above the mid-point level. Still some good amount of volatality is left in it.
ACC
WILL IT SUSTAIN ABOVE 1000


This stock is recently resisted at 1088 which is the cluster resistence of the fall from 1192 to 910 (1084) and trying sustain above the 1017 which is 38.2% fibo support of 1192-910. And taking the little bit longer picture, a move above 1084 it'll kiss the 1192 which is all time high and below 1017 then it'll retest the low of 910. As of now the good thing is that it just closed above the 1036 which is the 50DMA, for further rally it need to stay above the 1036 mark. Daily RSI is graduaaly moving above te mid-point level to give the further strength. Ditto Daily CCI is also moving above the mid-point level. By looking into all this things one can go long in this counter with the targets of 1084 and 1192. Really i love this stock and surely i go long in this counter.
HDFC BANK
AT CRITICAL SUPPORT


Now this stock formed Double Bottom at 1002 after ther fall from 1074 which is the Double Top resistence of 1075 and i feel it'll be weak in the near term, unless it wont cross abobe 1045. If 1002 is takes off then it'l test the 7 month old bull trendline which is connected the lows of 620-695 and if the trendline breaks then we'll see the level of 850. Leading indicators are all pointing towards weakness. Strength will come only above the level of 1045-1050.

Thursday, December 21, 2006

TATA STEEL


One of the worst performing stock in the recent bull rally. For tomorrow475 is the strong resistence area if that crosses then it'll hurdle at485 which is the short term resistence an then at 515 which is the longterm resistence. Daily CCI is given buy signal and RSI is still just belowthe mid-point level.
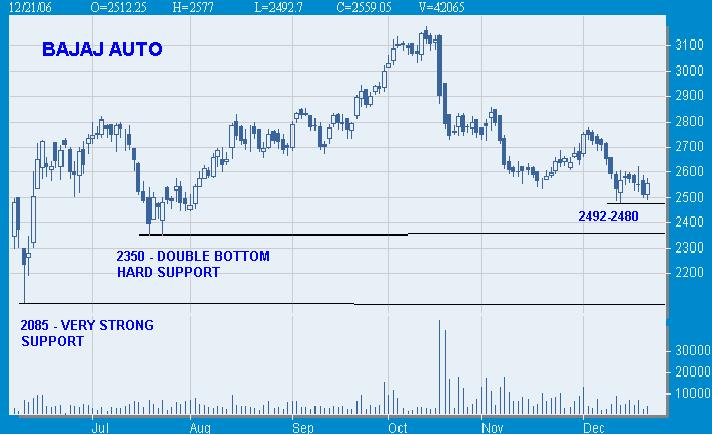
BAJAJ AUTO


This stock is continuosly struggling to cross the 2600 level and taking support at 2492-2480. If this stock takes the 2492-2480 support then it'lltest the July Double Bottom support at 2350. If that cracks too then thefall might stop at 2085. For me 2350 is the hard support for thsi stock.
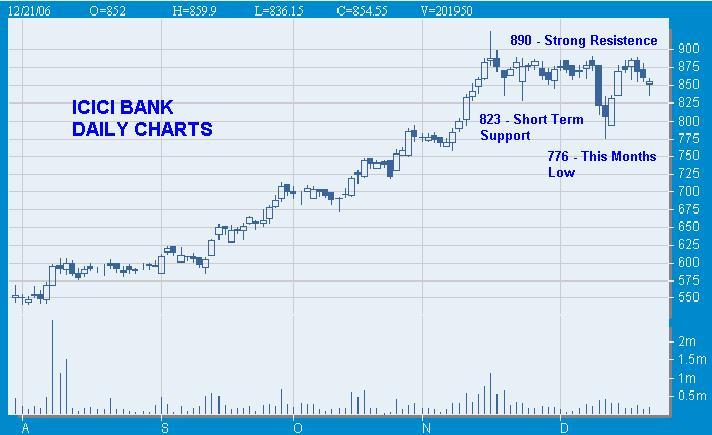
ICICI BANK


This stock is nearing to test the short term support at 823. And in thecoming sessions this stock will might struck in the range bound between890 and 775. 890 is the very strong resistence indeed and anything below823 it'll retest this months low of 776.