Monday, November 27, 2006

HDFC
A PENNANT FORMATION, TARGET 1925...


One of the strongest counter in Sensex. And now forming the BullishPennant and my target will be at 1925 and in the next couple of trading session we'll see the completion of the pattern. Currently we're trading at the higer resistece area which the 1.618% retracement of thefall from 1420 to 962 level. If wee see the strong sustain above 1705then we might see the level of 2170 in the longer term.
RELIANCE INDUSTRIES
LOOKING WEAK, STRONG SUPPORT AT 1235


Reliance looking very weak on charts and strong support is at 1235. And1215 is the DMA support. So if it holds 1235 then it'll keep movingwithin the price band of 1315 and 1235 anything below 1235 is very weakand put your stop loss at that level for your long positions. Andlooking into leading indicator all are very sluggish especially fromCCI and RSI.

Thursday, November 23, 2006

TATA STEEL
DOUBLE TOP AT 479.90 AND RESISTENCE AT 485.


On Daily Charts this scri formed Double Top at 479.90 and ahead of thatit got strong resistence at 485. If this scrip fails to cross the Double Top price and 485 then it'll retest the 460 level once again.A break above 480-485 level then it'll face the resistence at 510which is 200dma. Daily BB signalling that still some downside is likely as RSI too not very impressive. It says that we need to be verycareful at the levels of 480-485.

HDFC BANK
STRONG SUPPORT AT 1067...


In the recent times this scrip had a marathon rally and we also seensome slight corrective moves in between the rally. So as of now it made strong bottom at 1067 and resistence is at 1150 which is all timehigh for this scrip. If it holds 1118 then we can see the kissing of1150. On charts really it looks very good indeed. As the tradingsession goes on the Upward sloping Channel is getting more divergenceand it'll offer greater degree of volatality. And the Upward SlopingChannel is still intact.

Saturday, November 18, 2006

SENSEX 30
LOOKS BLEAK, SUPPORT AT 12950


finally we got something to see to end this marathon rally fromlow of 9875. I feel Wave 3 of wave 5 is getting ready to truncated.If the Sensex breaks the 13383 then it'll test the 12950 level and even it can test the 12300 levels also. RSI is encouraging the fall.Here i would like to suggest for every long position holders just keep your eyes on 13383 level.


HINDUSTAN LEVER
A MAJOR TOP AT 255

This stock retraced a little bit after resisting at 255 levels. SinceSeptember this stock is consolidating between 260 and 220 levels.And now its heading towards to retest the 220 levels. This stock isretraced 61.8% of the fall from 296 to 180 levels. As of now thisstock is unable to sustain above the 251 which is the 61.8% resistenceof the fall from 296-180. And the support comes at 224 which is the38.2% support of the 296-180 fall. The closed just below its 200dma,anything below this it'll lead to the 220 levels and might be even lower levels. Daily CCI is heading towards Extreme bearish zone. DailyRSI already below the mid-point level. So CCI, RSI, MACD and ROC are giving SELL signal which clearly tells the story of 220 levels.
TITAN IND
TESTING ITS 200DMA


Really it looks very bleak in point of technical. As it keepsresisting at 9 month bear trendline and now testing its 200dma whichis at 736. If 200dma cracks then we see more lower levels. If it takes support at 1736 then upside will be very limited. In the comingmonths we'll see the lower levels of 625. Even 636 is very crucialjust bcoz 636 is lower band of BB and some of the leading indicatorspointing bearishness, means 200dma is not sustainable one.

SUZLON ENERGY

TECHNICAL ENERGY IS STILL INTACT...BUT RISK...


This stock made the 8 month Bear trendline which is connected thehighs of 1429.95 and 1432 (04/07 and 11/14). And now heading to testthe 5 month bull trendline which is connected the lows of 778-11011281 and 1308 but never tried to penetrate the supporting trend line.In the larger picture we're seeing triangle formation and its about tocomplete the formation. If it breaks the supporting trendline then itwill test the level of 1281 and 1100. If the stock gets upper triggerthen i put my resistence at 1680 and my long term target will be 2050.

INDIA BULLS
CAN WE SEE SOME INDIA BEAR...


Sell this stock as it takes off the level of 545. Some of the leadingindicators pointing towards that. This stock formed Bearish Engulfingpattern on Daily Charts. If the 545 is triggered then it find supportat 490-455 levels. Or even we can see the level of 375 but thats too far away and lets keep our eye on the levels of 545 and 490-455 leevl.

Wednesday, November 15, 2006

ITC
DOUBLE BOTTOM AT 183.70


Now this stock looks good to go long for something 5% appreciation.And even on Candlesticks it formed "First Sunny Day" pattern. So fromhere on i can expect the level of 192. Now place the stop-loss at183.70 and cover at 192. For 192 level it need to break the 50dmarersistence which is at 186.50. But the worrisome factor is Indicatorsall are showing lot of sluggishness. Even i tell you that downside isvery limited coz 200 & 100dma is placed at 182 & 181 respectively.
HDFC
MAJOR TOP AT 1580, INDICATORS CONTROLLED BY BEAR


I feel this stock is worth to go short in it with the stop loss of1580 which is the Double Top formation. For the target of 1420, whichis the strong support for this stock. If it holds the 1420 levels, then i expect the range bound traing in it betwen 1580-1420. Of 1420takes off then it'll test the 200dma which is at 1300. Look into the Daily RSI we'll see the Divergence in it. Daily CCI is below itsextreme levels. Continuosly resisting the upper band of BB, all thispointing towards the Bear attack.

Tuesday, November 14, 2006

ASHOK LEYLAND
DOUBLE TOP AT 47.25


On Daily Charts this stock made Double Top at 47.25 and formed the Bearish Engulfing Pattern which signals the SELL on this stock.Daily CCI is off from the levels of extremes and Daily RSI kissed themid-point level. So place a stop loss at 47.25 and go short in it andcover at 43.10 and 40.50. Just few days beck this stock got the breakout from the Downward Sloping Channel and now its making the lows overthe Upper Trendline of the Downward Sloping Channel.
TATA TEA
MAJOR BOTTOM AT 730


In the last six trading session this stock formed strong bottom at730-733 levels and also on Daily Candlestick it formed the "FirstSunny Day" Pattern. Place a stop loss at 730-733 levels and go longand cover at the levels of 780 and 803. 803 is the 200dma which will be crucial level for this stock. Daily RSI & CCI is still below the mid-point level but this two indicators are gradually moving above the mid-point level for further Bull steam.

Thursday, November 09, 2006

HDFC BANK
POSSIBLE RANGEBOUND BETWEEN 1075 & 950...


Possibly this stock will struck in the range bound between 1075 and 950 in the near term. Ever since making the all time high of 1075 andretrace to 950 trading in rangebound with positive bias. Daily CCIis just heading towards the extremes and Daily CCI is still firm abovethe mid-point level. Above 1033 it'll test the 1075 and below 985 it'lltest the 950 level. My intermediate target is 1052-1200 levels. As per Waves still we're in the Wave 3. But still not confirmed that Wave 3is terminated or not.
ACC
MAJOR TOP AT 1025


This stock formed Double Top at 1025 and made anothe rDouble Top at 1009. The support is at 987, below 987 it'll test the stronger supports like 966 and 952 and thereabout it'll test the 886 levels. The resistence for this stock is at 1070. Daily CCI is just below theextremes and Daily RSI is still above the mid-point level. Juat few trading session back this stock penetrated the Bollinger Band and nowtrading inside the band levels and this suggest it'll likely test thelower band of BB at 965. So watch out for the levels like 1025 and965-966.
ICICI BANK
KISSED 800 MARK...


Still looks strong on the charts, almost near to 814 which is the 161.8% retrace of the fall from 671-440. Since kissing the 440 markin early June this stock rallied non-stop till now. The strong support is at 758. If it cracks the 814 mark then it'll find resistence at 852.
EUR/USD
DESCENDING TRIANGLE INTACT


On 60 min chart its trading within the Descending Triangle formation. And also completed the Wave formations. This pair is resisting the Resistence trendline which connected the highs of 1.2820-1.2808 and also kissing the top of band of the Bollinger Band. Most likely it'll retest the 1.2746 and will continue to complete the Triangle formation. Break below the 1.2746 it'll give the confidence to kiss the 1.2683 level.

Wednesday, November 08, 2006

USD/JPY
A POSSIBLE TRADING RANGE & WAVE FORMATIONS


On 60 minute charts it'll struch within the trading rangeband between 118.46 and 117.26. Just now it hit 118 which is 61.8% retrace of the fall from 118.46 to 117.26. The trigger band is 118.46 and 117.26...

Tuesday, November 07, 2006

UNION BANK OF INDIA
FORMED TRIANGLE FORMATION


On Daily Candlesticks it formed Bearish Engulfing Pattern. And also formed a smaller Triangle formation. The key resistence is at 138.30 and the key support is at 121.10. Within that it'll stay in pretty rangebound movement. So breaking the triangle the upper target is 142 and lower target is 110. Daily CCI is just kissed the mid-point level. And Daily RSI just dipped below the mid-point level. The conclusion is Daily CCI and RSI and the Bearish Engulfing all signal towards the SELL.
USD/CAD
HEADING TOWARDS 200DMA


Since last 5-6 months this pair is trading within the Symetrical Traingle formation. And now its getting ready to test its 200dma which is at 1.1294. A break below the 200dma then it test the 1.1179. And the strong resistence is the 1.1400 which is the top of the Triangle line.
EUR/JPY
WILL IT BREAK THE 150.73


Now this pair is getting ready to break the 150.73 level. On Daily charts it formed Ascending Triangle formation. Since hitting 150.73 in late August beging to trade within 148 and 151 about 300 pips. On daily charts its hitting the top of the Bollinger Band. If it breaks the 150.73 the next resistence is at 151.5 and 154 levels. Still got the time to complete the triangle formation.

Monday, November 06, 2006

RANBAXY
STRUGGLING TO CROSS 200DMA
MAKING OF POSSIBLE HEAD & SHOULDERS...
DOUBLE BOTTOM AT 394


This stock is resisting its 200dma which is at 412. And at the same time its now making the Right Shoulder, a possible Head & Shoulders pattern on Daily Chart. And now this stock made Double Bottom at 394. 394 will be the key support for this stock. One can buy this stock above its 200dma with the stop loss of 394 for the target of 441. 441 is the Top of Right shoulder. a crack of 441 will fail the HNS formation. And crack below the 394 level will lead to continue the HNS formation. Below 394 the next strong support comes at 380 then it'll re-test the level of 334. The key resistence for this stock is at 412 and 441.
TATA STEEL
CLOSED ABOVE 200DMA


After cracking below the 200dma which is at 505. In few weeks back i said this stock will test the 485 mark and does it. So from here on what. This will be answered by 200dma only. The short term support is at 485. If it sustains above the 200dma one need to put a stop loss at 485 and book profit at 540-545 levels and possible Double Top target of 570. BB is getting narrower which suggest the lower volatality ahead. Daily CCi is just kissed the mid-point level. Daily RSI just crossed the mid-point level. So taking all this into account, definetly one can go long in it with the stop loss at 485 and for the target of 540-545 and 570. Go long only above the 200dma.
AUTO STOCKS
ON ROLLER COASTER

MARUTI UDYOG
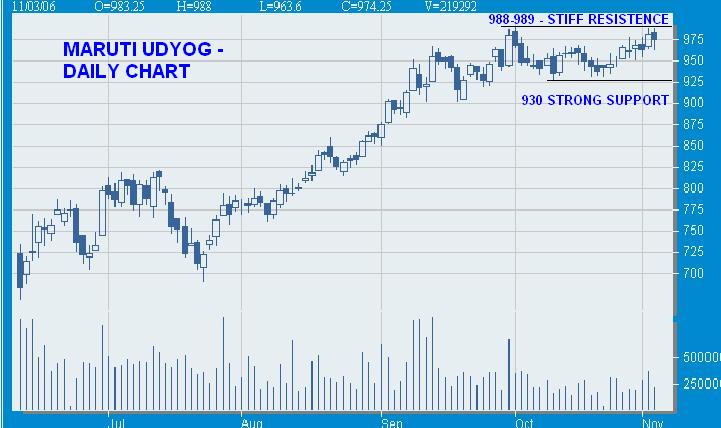
STRONG RESISTENCE AT 988-989


This is the only Auto stock which looks good on charts. The strong support at 988-989, a break above that the target will be around 1050 and the key strong support is at 930 level. 930 will be the medium term stop loss for the target of 1050.
TATA MOTORS
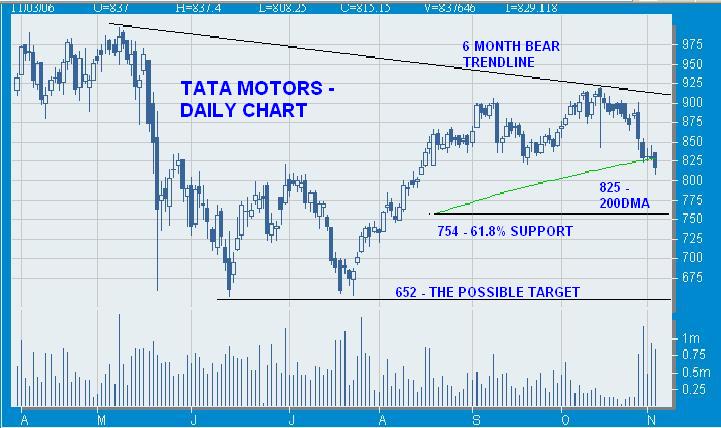
TRADING BELOW 200DMA


This stock is trading below its 200dma which is at 825 and also tested its 100dma which is at 814. As long as it trades below its 200dma it'll likely test the level of 754 and possibly 652 on the cards. To negate all this it need to overcome the 200dma. If it once sustain above its 200dma then it'll try to test the Bear trendline. Or we'll see some consolidation between the Bear trendline and the 200dma.
BAJAJ AUTO
STRONG BOTTOM AT 2728-2730


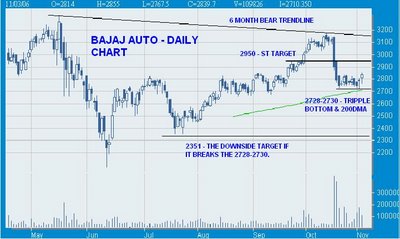
This stock fall sharply after kissing the 6 month bear trendline to test the 200dma. In the short term it'll likely test the 2950 levels. This stock made strong support at 2728-2730. If the 2728-2730 support takes off then it'll re-test the level of 2351. The key resistence is at 2950 above this level it'll test the Bear trendline target of 3150. The ultimate stop-loss is at 2728-2730.

HERO HONDA
A DOUBLE TOP AT 771


This stock made Double Top at 771 and the key short term support is at 727. By seeing the chart in the coming session it'll trade within 800 and 727. Still this stock is trading below its 200dma which is at around 800 mark. Currently this stock is struck in the vital fibo retracement levels as i say 800 and 737 are the 61.8% fibo resistence and 38.2% fibo support of 900-637 fall. Break above the Double Top of 771 it'll kiss the 800 and thereafter we'll see the new bull rally which will take to the 900 levels. But 727 is not ruled out yet.
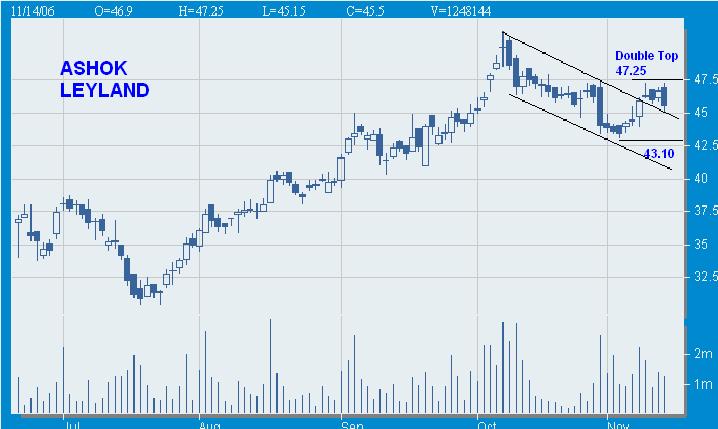
ASHOK LEYLAND
TRADING IN DOWNWARD SLOPING CHANNEL


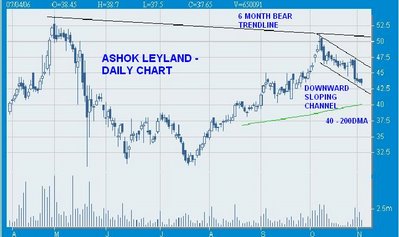
This stock is trading within the Downward Sloping Channel and now its trading at 38.2% fibo support of 30.50-51.95 and more likely its trying to test the 200dma which is at 40. In the medium term the key resistence will be the 6 month Bear trendline...
EUR/CAD 1.4393
TRADING BELOW ITS 200DMA


This pair is trading below its 200dma which is at 1.4413. After making the top of 1.4429 and now slowly heading towards the 1.4334. 30min RSI is slightly heading above the mid-point level. I feel it'll takesupport over here at the current levels of 1.4390. And for time being it'll trade within the rangeband of 1.4429 and 1.4334 a volatileof 95 pips.