Monday, October 30, 2006

VSNL 446.95
WILL IT TEST THE 500 LEVEL...


This stock formed bullish triangle formation, the breakout level from the triangle is at 452. Break above the 452 i put my target at all time high of 515.35. Daily CCi is at extremly bullish and RSI is inching towards overbought region. If it fails to sustain above 452 then it'll test the 5 month bull trendline which connected the lows of 301.10 and 393.95. Still some time left for more consolidation i mean to say to complete the triangle formation.

Saturday, October 28, 2006

SENSEX 12906.81


when Sensex kissed the low of 12612 on 10/23 then i thought it'll close the gap of 12632-12556 but it bounced back from that level, i feel that gap is the strong support for this rally. When it closes that gap tehn i feel that Wave 3 of the Wave 5 is surely have the termination. Unless it'll keep continuing this rally which resumed at 9875. The key resistence for the sensex is at 12995. If it penetrate the 12995 then i keep my target at 13339 which is the 1.618% of Wave 1 of the Wave 5. Daily CCI is just heading towards the Extreme Bullish, Momentum is also showing inherent strength. Daily RSI is hovering at overbought region.

Thursday, October 19, 2006

USD/JPY 118.35
TESTING THE 118.20 ON 60 MIN CHARTS


On 60 Min charts this pair is heading lower within the Downward Sloping Channel and made the short term bottom at 118.20 and 60 Min RSI is at oversold region. So it possibly it'll test 118.70 and 119. 119 is the 100dma resistence. If it triggers 118.45 tehn it hit 118.77 and 119.
SENSEX 12723.59
LOOK OUT FOR THE GAP, ON THE WAY TO CLOSE...


Now Sensex is inching towards closing the gap of 76 points from 12558-12632 this two level will act as the key to this so called 3rd of the 5 wave, by closing the gap and gets weaker then it'll test the level of 12228 and possibly 11800. Those who are short in market they can put a stop loss at 13000 and cover at 12228 and 11800. And still we're in the 3rd of the 5 wave. Daily Momentum is slowing slackiness and Daily RSI is visibly heading towrds below the mid-point level.
GBP/AUD 2.4727
TRADING BELOW THE 6 MONTH BULL TRENDLINE


This pair finally breakdown from the 6 month Bull trendline, and still trading below the trendline, Daily BB, Daily RSI all suggesting further weakness lies in this pair. Now it hovering around the 38.2% fibo support of 2.5420-2.3682 which comes at 2.4756 sustaining bleow this it'll test the levels of 2.4551 and 2.4345. Considering RSI and BB still it'll trade with the upper larger trading band...The big resistence is at 2.5150. For any upward moment it need to cross the 2.4829 which is 100dma. sO 2.4660 is the recent bottom for this pair. If 2.4660 is taken off then we'll see more retrace in this pair.

Sunday, October 15, 2006

THE PVT SECTOR BANK
TECHNICAL SIDE STORY

ICICI BANK 695.20
672 THE STOP LOSS

After making the all time high of 713, the stock began to trade within the Downward Sloping Channel. My immediate term stop loss is at672.50 and for any mean of further uptrend it need to break the topline of the Downward Sloping Channel, i mean to say the move andsustain above the 700 mark. If it trigger my stop loss of 672 then itcontinues the fall of 713 to steeper level. It'll test the level of 609 and 575 levels. If it triggers the 713 mark then i put my targetat 760 and 815. 200dma is currently placed at 585.
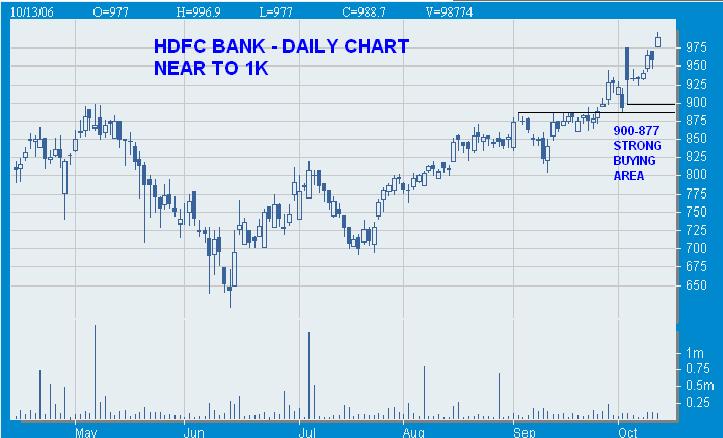
HDFC BANK 988.70

NEARING OF 1000


Just 10 odd rupees to kiss the 4 digit mark. This stock made the superbrally from 620 levels.On firday it made a gap of Rs.7/- the gap areais 970-977. So 970 is the key support and 1000 is the key resistencejust bcoz of 1000 is the psychological barrier. And the 1005 which isthe 138.2% fibo of 898-620.Daily Rsi is at the overbought region. Strong support is at 900-877 levels. Buy this stock at the levels of 900-877.

UTI BANK 410.00
NEARING ALL TIME HIGH


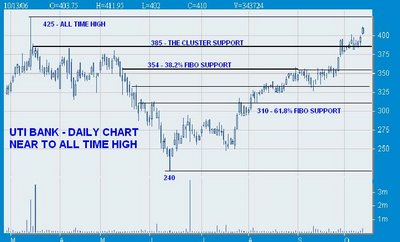
Just to kiss the all time high of 425, now this stock is begin to sustain above the 385 the 78.6% cluster resistence of 240-425.The support for this stock is at 354 which is 38.2% fibo suport of425-240 and then at 310 which is 61.8% fibo support of 425-240.My target above the 425 level is 468-495 and even 540.Daily CCi is atthe extreme levels this indicating the penetrating the 425 mark.Daily RSI is at the extreme overbought region. I feel this is the besttime to book profit in these stock and buy at the above mentioned support areas.

KOTAK MAHINDRA BANK 344.95
STRONG BREAKOUT EXPECTED


This stock is waiting for 347 breakout, to kiss the level of 400.Support lies at 300 in case if it fails to 347 breakout.

YES BANK 99.70
CAN IT STAY ABOVE 100


Now this stock is struggling to croos the 78.6% fibo resistence at 100.In the last 5 to 6 trading session it made the 99 as the strong base tokiss the all time high of 109, if it penetrates 99 then it'll test the93 which is 61.8% fibo support of 67-109.To maintain this rally it need to stay above 93. If 93 takes off then it'll retrace the rally from the low of 67 and it'll kiss 83 mark. 83 believed to be the strong support for this stock, 200dma is at 86, 100 dmaa is at 85and83 is the 61.8% from 109-67. Daily BB is indicating further upside is still there. Weekly CCi is at Extreme levels, MACD is giving BUY signal, but Momentum indicator is somewhat losing it. Above 109 my targets are 119-125-130-135.
ING VYSYA BANK 141.35
158 THE KEY TO THIS STOCK...


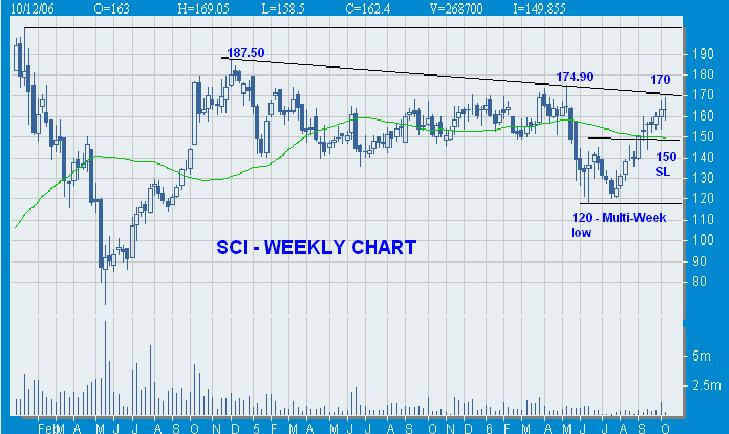
Resisting at 150 levels.The next crucial resistence is at 158 which is61.8% fibo resistence of 204.8-82. The vital support is 135 which is200dma. If it dont sustain anymore and dosent cross the 158 mark thenit'll restest the 82 mark likely. As you see in the chart in the latepart of 2005 it formed Head n Shoulders and the Neckline was 158. Sonow 158 is the cluster support of 204.8-82. One need to watch out for158 level which is Head and Shoulders neckline price and the Fiboresistence.

Saturday, October 14, 2006

CHF/JPY 93.97
RISK OF PENETRATING THE 6 MONTH OLD BULL TRENDLINE...


This pair looking weakness and possible it might penetrate the 6 month old bull trend line which formed from the low of 89.88 and 93.16 and at the same time it formed the Symetrical Triangle and at anytime i'm going to see the completing the Triangle pattern. If i take the extreme points of 95.70 and the 93.16 levels then i view it'll make consolidation at these levels.
AUD/NZD 1.1426
IS THE KIWI RULE EVENTALLY OVER ?


This pair possibly found the bottom at 1.1200 levels. I feel the Kiwi rule is over against there Aussie. Now this pair is trading between 1.1204 to 1.1495 a 291 pips movement and 1.1499 is the 23.6% fibo resistence of the fall from 1.2453 to 1.1204 (1249 pips). Above 1.1499 it'll test the 1.1681 which is 38.2% fibo resistence of 1.2453-1.1204. By taking the longer picture, from the low of 1.0431 (first week of Dec 2005) it made the great high of 1.2453 (last week of Jul 2006) the rally of 2020 pips. It retraced at the maximum level, 61.8% of 1.0431-1.2453 which is at 1.1205. This suggest me that Kiwi rule is eventully over from here on Aussie will rule against Kiwi. If 1.1205 is taken out then it'll test the 1.0431 level. As long as it dont cross the 1.1681 level i point my finger towards the level of 1.1204 and 1.0431. For me 2020 rally is all over and 1.2453 the top is formed.
CAD/JPY 105.12
POSSIBLE RANGEBOUND


Now it is forming Rectangle formation between 106.42 to 103.71 on daily charts. The rally from the low of 98.31 to 106.42 is not completed yet, this 800 odd pips rally is valid as long as it stays above 103.32 which is 38.2% fibo support of 106.42-98.31 and 103.71 which is 9/20 low. Now in the last couple of trading days it formed Double Bottom formation, i feel this will take the price towards 106 levels. Daily RSI is just hovering above 50 mark and Daily Bollinger Band suggest that near term movement will be within the band of 106.42-103.71. Breakout above 106.42 i put my target at 109.10 and anything break below 103.71 it'll retrace the 800 odd pips rally and it take support at 101.44 which is 61.8% fibo support of 106.42-98.31. For further Loonie bull rally it need to take off the 106.41 levels, for that Crude need to support the Loonie.

Thursday, October 12, 2006

ZEE TELE 297.75
A POSSIBLE RANGEBOUND IN NEAR TERM


This stock will surely fall in possible rangebound between 329 and 260 levels in the coming trading session. From the rally of 259.40 to 328.90 is retraced maximum at 61.8% which is at 286, but still 259.40 is valid support one as long as it trades below 302. Once it sustain above 302then 329 and beyond 329 is quite possible. Now below 286 it'll retest the 259.40 and above 302 it'll test 329. The rally that we saw from the level of 189 to 328.90 is still valid one as long as it trades above 260. Ove the last couple of trading sessions it tested the lower band of BB twice and today it rebounded very well. Lower band of BB is placed at 61.8% fibo support of 329-259. Daily RSI is just triggerd the mid-point level. And even u can see the break of bear line on RSI charts. Even Daily Momentum is also getting carried over with Bulls.
SCI 162.40
A Huge Breakout on the Cards,


On weekly charts, in the next few trading session i'm expecting a multi-week breakout at 170 levels. On last week and even this week still one day left resisting at the multi-week resistence. The good thing is that this stock is trading above the 40wma at 150 levels. In the past SCI sinked from 202 to 69 levels in early part of 2004, now trading well above the 61.8% fibo of 202-69 which is at 151. So keeping long in mind place the stop loss at 150 levels. And wait to hit the trigger of 170 levels once the 170 is taken off then i put my target of all time high that i 202.70. Anything below 150 it'll retest the multi-week low of 120 levels.

Wednesday, October 11, 2006

i-FLEX SOL


This stock is nicely consolidating between 1475 to 1400 levels since mid August. Technically speaking it's making bullish rectangle pattern.Break above 1475, the next target comes at 1625 and 1717 this are all new territory for this stocks. If once cracks the 1400 mark then u cansee some top pressure will build on and it'll the test the 200dma currently at 1235, 1235 is the level of 38.2% fibo support of 1475-840.As long as it stays above the 200dma and fibo support then highertargets are valid. As of now we need to see how long it'll resistat its 52 week high.
RELIANCE COMM 338


This stock moved nicely from the all time low of 186.40 to all time high of 355.80. Now its trying to penetrate the recent supportof 336. For the last few trading session it traded in rectangle bandof 336-350. Anything below 336 it'll test the support of 310 and 280.

Tuesday, October 10, 2006

MARUTI 952.50
WAITING TO MOVE ABOVE OR BELOW 991-902


This stock is caught in the middle of nowhere. Where is it seeing the road a 1000 or back to 900. Still fuel left in its petrol tank. Above 991 it target the level 1045 and even 1100 and below 900 it takes support at 825. 825 is the level where the 200dma is placed, and even 100dma is also placed there. If it test the level then its best buy as far Technical is concerend. The upper band of BB is showing pretty flat which i feel it wont go far beyond the 978-991 mark for time being.
GSK PHARMA 1223.10
HOVERING JUST ABOVE 200DMA


This stock made a great rally from the low of 965 and made high of 1303 which is the 61.8% retrace of the fall from 1551 to 891 levels. Since reaching 1303 this stock is just consolidating just above its 200dma currnetly placed at 1225 anything below this it'll take the support at 1143. And the resistence placed at 1410 and then 52 week high of 1551.

Monday, October 09, 2006

SENSEX 12365.83
TURNED CHOPPY


Index turned into very rangebound trading between 12489 and 12145. Bollinger Band still suggesting the northwards. I feel it take some time and then it try to ove northwards. But it happens as long the sensex does not penetrate the 12145 level. Support for the Sensex is at 12145-11833 and 11445. The only resistence for the sensex is at 12489 and then all time high of 12671. Taking the leading indicators the Sensex is showing otherwise, i feel this rally is got tiredness as i say it may retrace the index to the level of 11192 or even the possible thing an happen is the larger part of consolidation. First thing is let closely watch the level of 12489 and 12145. Then we can come into sonclusion...
GE SHIPPING 301.25
THE TREND REVERSAL ON THE WAY...


Since reaching 300 the couldnt able to make strong foundation above the 300. The rise from the recent low of 171 and at the current price of 300, i feel the Wave 3 is about to terminate. Here what i want to say, from 171 to 240 is the wave 1 and from 240 to 196 is the Wave 2 which corrected 61.8% of the W1, and from 196 to 312 which is the 161.8% rally of W!. W3 will terminate when it penetrate the 278 levels. The next major support is at 258. Here i make a strong call as SELL SELL with the stop loss of 312 and cover the position at 278 and 258...All the leading indicator are favoring the Bear attack. Overall the rally from 171 to 312 to remain on track then it should not go below the 258 level. Or else then it try to retrace the rally from 171 to 312.

Sunday, October 08, 2006

HCL TECH 553.65
545 THE STRONG SUPPORT, RESISTING AT 200DMA...


This stock is now trading in the smaller Downward Sloping channel since mid-august. If 545 is taken away then it'll make the fall of the 602. The thing is that it retraced the 75 percent of the fall from 706.65 to 362 levels. Now the 574 is key resistence for this rally. And the key support for this stock is at 510. As long as it stays above 510 then the rise from 362 to 602 is still valid one. Even 545 is the lower band of BB. Just watch out the level of 545. To resume the long term rally it need to cross the 558 level which is the 200dma.
NTPC 130.65
RESISTENCE AT 78.6 % FIBO


This stock is trading in the Upward sloping Channel since June. And now 145 is the next ultimate resistence for this stock. 145 is valid one as long as it satys above 124 (redmark) and now resisting at 133. The next resistence is at 138 and then 145. As i mentioned the level of 124 along with it this stock will have to maintain the running Uptrend Sloping Channel. By applying leading indicators this will try to test 124 level before it moves further up.
TATA MOTORS 893.70
1000 IS ON THE CARDS...


On course of breaking the 900 levels. Above 900 levels i put my resistence target of 1000 level. Now for the next few trading session one can watch for the look-a-like Double Bottom price of 885, if it cracks then it'll go some more rounds of consolidation. If it holds well and try to break the 900 level then 1000 is not too far away. Momentum indicator is supporting for the 900 level breakout. BB is not giving muc clue. To maintain this uptrend it need to stay above the 864 level which is the 61.8% fibo of 997-650.
THE FX MAJORS :
EUR/USD-USD/JPY-GBP/USD-USD/CHF


EUR/USD 1.2602


The medium uptrend from 1.1640 has already made an important top at 1.2980 and price actions from there represent a larger scale consolidation to this whole medium term rise. Hence it closed below the crucial support of 1.2630 and now it might try to penetrate the 100dma level at 1.2515 and now its is looking likely. The rally from 1.1640 to 1.2980 is still not over as long as it stays above 1.2469. But once move down the 1.2469 level then it'll retrace the rally of 1340 pips. But it retraced the fall rally from 1.3666 to 1.1640. Now it trading below the 1.2650 which is 50% of 1.3666-1.1640. In the larger picture it'll likley try to consolidate between 1.2980-1.2449. The lower band of Bollinger Band level is at 1.2534

USD/JPY 119.01

Following broad based dollar strength, USD/JPY rose sharply last Friday, breaking through mentioned 118.88 resistance. More importantly, it's has now broken through multi-year trend line resistance (147.68 to 135.20 then to 121.38, now at 118.42 level). The strong medium term rise from 108.99 could either be resumption of the year long up trend from 101.65 to 121.38, in other words, the correction from 121.38 has totally finished at 108.99 already. Or it could just be part of the consolidation that started at 121.38. But in either case, a retest of 121.38 high should be seen. We'll hold on to this view as long as USD/JPY stays above the current inner rising channel (lower channel at 116.74 now). On the downside, break of the current inner channel will argue that the rise from 113.95 has completed and turn focus back to the lower side of the outer channel (now at 115.22). This will also be the first alert that medium term rise from 108.99 could have finished.

GBP/USD 1.8705


Cables level of 1.8600 is still not secured an currently trading just above the 100 pips of 1.8600 level. 1.8603 is the level where it rebound from the high of 1.9092. And then it made another high of 1.9074. Cable is unable to stay frim above the 1.9000 levels. Now the crucial support lies at 1.8641 which is the lower band of Bollinger Band. Before it touch the lower band it has to breach the 100dma is at 1.8686. Anything slips below 1.8546 then it'll retest the level of 1.8177. As of now as long as it stays below 1.8900 more the downside is set.

USD/CHF 1.2601


This pair touched as high as 1.2635, breaking marginally above mentioned 1.2594/1.2620 cluster resistance. And even it spiked the Triangle on intra-day basis. In the bigger picture, USD/CHF's whole fall from 1.3287 has completed at 1.1945 already and subsequent rebound from 1.1919 to 1.2594 represents part of a larger consolidation. Firm break above 1.2612/23. Now it closed at 1.2615 which is 50% of 1.3287-1.1945 now it try to eliminate medium term bearishness and indicates a stronger medium term rise is underway towards 61.8% retracement at 1.2773 first. We'll hold on to this view as long as USD/CHF stays above 1.2457 support. However, a break below 1.2457 will indicate last week's break was another false break. In such case, USD/CHF is still considered in sideway trading and could retest 1.2182 cluster support (61.8% retracement of 1.1945 to 1.2594 at 1.2192) again. Now it closed at the top band of the Bollinger Band and Weekly RSI is moved over the mid-point level. I feel technically next week i'm bullish on this counter. In case if it keep resisting the 1.2612/23 then it'll trade in the range bound and try to complete the bullish triangle formation.

Thursday, October 05, 2006

NALCO 214.30
FIBO SAYS THE BIG FALL IS NOT OVER


This stock is struggling to come over by the 150 bucks fall from all time high. The minimum retrace level is at 220 and currently is trading at 100dma. What i see is that if it comes over by 100dma then it'll test the level of 242-245. 242 is the 38.2% fibo of 335-185 and 245 is the 200dma. This is the level what i'll look for in the future. If it overcome this level then it'll retrace the 150 bucks fall. Or else the 185 will be in danger. Even at this lower level the daiy RSI is near to overbought region daily CCI is at extreme bullish level. 100dma is at 214-216 levels. For any manner it has to come over the 100dma then only we can see some short rally.
HINDALCO 172.55
A CHOPPY ALUMINIUM...


This stock is trading a very choppy since mid-september. On daily charts it is completing the Triangle pattern. As long as it stays below 182 which is 38.2% fibo resistence of 251.4-139 then 139-141 is on the cards. Only above 182 will try to retrace the fall from 251.4 to 139. It means the fall from 251.4 to 139 is not over yet. It'll confirm when it sustain above 182. Above 182 it'll test the key levels of 195 and 208. If it breakdown from the triangle pattern then it'll try to retest the level of 139-141. And breakout from the triangle then it'll retrace the 100 bucks fall. Day by day the BB is getting narrower. Daily CCI is at extreme bullish, daily RSI is above the mid-point level, Momentum is slowly gathering the real momentum. All indicators that i mentioed are well and ok.
NZD/USD 0.6635
TRADING IN TIGHT RANGE


This pair is trading in tight range between 0.6657 and 0.6625 just volatile of 32 pips. Either way make the way for this pair. But RSI is pressuring the Kiwi to Northward and right now its just at mid-point level. So even the Hourly bull trendline support is holding this pair. So 0.6625 is the key for this pair. Anything below the 0.6625 level it try to test the level of 0.6565

Wednesday, October 04, 2006

RELIANCE 1149.35
THE KEY RESISTENCE AT 1188


BB suggesting some trend reversal in it and the 1100 is the valid support in the coming days. 1100 is valid one as long as it trades below 1188 levels. 2day it created the possible inverted hammer. But for me the possible level is 1188 levels. Still its trading in the uppertrend channel. Daily CCI is slightly moving into -ve land. And most of the leading indicators are not showing any sort of strength to crack the 1188 levels. I feel before it cracks the 1188 or all time high of 1195 it might try to retest the level of 1100 levels. On the charts it looking the possible Triple Top formation.
TATA STEEL
484 THE POSSIBLE LEVELS


Earlier i told the Tata Steel will trade in the range bound. So now this stock looks for the potential level of 484. The short term support is at 505 which is 100dma. It resisted at the BB so the BB sugest the level of testing at 484 is valid one. CCI is just below the extreme bullish level. I feel this stock will trade in the range bound rather then weeker one. The short term resistence is at 545.
SATYAM - 802.85
HEADING BELOW 775 LEVELS...


Now this stock looking very bad indeed in technical view. It break the trendline support which connected the lows of 560-651-769 and now at 818. Now its heading for the stronger support around 775 levels. BB support comes at that level. 200dma support is at 753. Watch out for this level. Daily RSI is below the mid-point level. Daily CCI is signalling extreme bearish.
EUR/JPY - 149.72
TRADING IN UPPER TREND CHANNEL


This pair is still trading in Uppertrend Channel. Its trying to close above the 150 level which it couldnt do it since reaching the 150.70 levels in late August. So for this pair 150 is the very significant level to digest. Still theres no danger of breaking the trendline as of now. This rall ywill sustain as long as it stays above 148.23 levels.

Tuesday, October 03, 2006

USD/CAD 1.1213
THE POSSIBLE HEAD AND SHOULDERS...


This pair is forming the very much possible of Head and Shoulders on Daily Charts. the neckline comes at just below 1.1100 levels and the Right Shoulder price i reckon the termination of the Head and Shoulder is at 1.1297. This pattern completes when it breaks below the neckline. On completing the H n S pattern it kisses the level of 1.1031 and possibly 1.0931. Daily RSI is at 64 value somewhere near to overbought region.
AUD/USD 0.7445
Technically High Bottom at .7433


This pair made the strong bottom at 0.7433-0.7435 and that three times with longer wicks on 8 hours charts. Now its trying to resist at 0.7500 the key to this pair. 8 hours RSI is still trading in the oversold region. Above 0.7500 it'll try to kiss the 0.7550 level.

Monday, October 02, 2006

DOLLAR FALLS...

Dollar weakens against all majors, EUR/USD is trading at 1.2745 from the low 1.2662, USD/JPY trading at 117.62 from the level of 118.39, GBP/USD is trading at 1.8860 from the low of 1.8678, USD/CHF is trading at 1.2424 from the level of 1.2525, USD/CAD is trading at 1.1155 from the level of 1.1219, NZD/USD is trading at 0.6563 from the level of 0.6485 and the AUD/USD is trading at 0.7480 from the level of 0.7434
STEEL FINALLY TO ROLL OUT

TATA STEEL - 535.65
HEADING TOWARDS DOUBLE TOP


This scrip is making a larger Triangle formation. Since reaching and making Double Top at 570 it fall to the range bound trading and it even get it into choppy trading as the day progressed. Now it slightly heading towards the 570 mark, on the way to the target it need to cross Two hurdles coming at 544 and 564. In case if it fails to stay above the level of 564-570 level then it begin to retrace everything which it gained from the level of 377. If once clear the 564-570 level then 377 low is eventually over, and there it move towards all time high of 679. As long as it stays above the 484 level then 570 level is valid, if once begin to penetrate the 484 then 377 is valid to test. CCI is at extreme bullish as so RSI too hmm making +ve divergence on daily charts. Even on daily charts the Momentum is getting on the track. All leading indicators are showing +ve one.

SAIL - 77.95
Still in The Consolidation Picture


Is it really heading to move towards 87 levels and then at 97. The patter looks seems to be. But as the days pass the Consolidation will be more and much larger. Now the 77 and 80 is the level to watch. The fall from 96.40 to 61 level is likely to be over if it stronly closses above 83. But it can retest the level of 61 if it tr to penetrate the 70.55 level. As long as it holds the 70.55 level then 87 level will be valid. On the little bit taking bigger picture of the stock, we can see a bigger consolidation on the cards between 86.90 and 61 levels. Right now CCI is at the xtreme levels and RSI above the mid-point level and more key is that this stock is trading above the 200dma. I'm bullish on this counter. One can go long in this with the stop loss of 70.55. The target i mention is at 87 and 97

Sunday, October 01, 2006

THE MAJORS TECHNICAL OUTLOOK :

EUR/USD - 1.2677


EUR/USD has turned sideway since reaching 1.2978 in early June and since then, price actions have been choppy and outlook has turned mixed. And the situation got worse after the rise from 1.2449 has failed to break through 1.2978 and reached 1.2939 only. EUR/USD's correction from 1.2978 was held by 38.2% retracement of 1.1639 (2005 low) to 1.2978 (2006 high so far) at 1.2467. Retreat from 1.2939 is also held by 61.8% retracement of 1.2457 to 1.2937 at 1.2628. This is still maintaining the possibility that a medium term top is not formed yet. We'll hold on the the view that on the downside, break of 1.2630 cluster support will shift favor back to the case EUR/USD is still bounded in a larger scale consolidation that started from 1.2978 which should be followed by retest 1.2457 cluster support (38.2% retracement of 1.1639 to 1.2978 at 1.2467). But even in such case, medium term bullishness remains as long as such consolidation is contained by 1.2322 cluster support (50% retracement of 1.1639 to 1.2978 at 1.2309) On the upside, above 1.2829 will turn focus back to 1.2978 resistance. But still, a firm break above 1.2978 is needed to confirm medium term up trend from 1.1639 has resumed for 78.6% retracement of 1.3668 to 1.1639 at 1.3234. Otherwise, further choppy consolidation could still follow. Now everything is depend on the 1.2630 level. If it holds then good or else see the level of 1.2560

USD/JPY - 118.11


Dollar gained nearly 200 pips against Yen and its on the way to test the hardest resistence at 118.15-118.28. Above this 118.8 will be the next crucial resistence. If this pair cross all the levels that i mentioned then it test the higher levels of 119.4 and 121.38. As trading near to the 8 year bear trendline i feel some more fall will occur on this pair. Everything dependes on 116.08 level. 116.08 is the reversal level for this pair. If it holds the 116.08 level then further rise will be on the cards. Another heavy resistence will come at the 118.88 which is 78.6% fibo of 121.38-109.

GBP/USD - 1.8724


Still 1.8600 level is very much in underthreat, for time being it made the bottom of 1.8633 just shy of 33 pips and closed at 1.8724 as you can see long lower wick. Still the bottom of 1.8633 is not confirmed for retarce of the fall from 1.9074 after the galloping rally from the level of 1.8603 to 1.9074. Well the rally from 1.7251 April 06 to 1.9144 in Agust 06 is stil in intact and therez no fear for this rally as long as it stays above the 1.8420 which is 61.8% of 1.9144-1.7251. As of now the rally from 1.8177 to 1.9144 is still holding and its threatning to test the low. 1.8605 which is 50% fibo of 1.9144-1.8177 and trading below the 1.8744 which is 61.8% fibo of 1.9144-1.8177. The next strong support lies at 1.8546 and then at 1.8420. Even 1.8596 is nothing but the 38.2% fibo support of 1.9554-1.7047.

USD/CHF - 1.2502


USD/CHF falled from 1.2623 to make the low of 1.2292. This pair need to cross the 1.2569-1.2595-1.2623 to terminate the Traingle formation. Here i call further weakness for Swiss Francs on Dollars. Breaking the Triangle it test the 1.2715, as of now its testing the 50% fibo of 1.3196-1.1948 which is at 1.2570 and after 1.2715 then it the level of 1.2800.
Taking the bigger picture of this pair whole fall from 1.3283 has completed at 1.1919 already and subsequent rebound from 1.1919 to 1.2594 represents part of a larger consolidation. USD/CHF then turned sideway and trade inside established range between 1.2182 and 1.2620. with 55 days EMA staying essentially flat. As long as USD/CHF is limited cluster resistance of 1.2594/1.2620, medium term bearishness still holds and further weakness could still follow to retest 1.1919 low. However, a break below 1.2182 cluster support (61.8% retracement of 1.1919 to 1.2594 at 1.2177) is needed to confirm underlying weakness first. Otherwise, the current fall could just be part of an extended consolidation which will further gyrate inside established range. But firm break and sustained trading above this resistance zone of 1.2594/20 will bring much stronger medium term rebound towards 61.8% retracement of 1.3283 to 1.1919 at 1.2762 first). Weekly RSI just crossed the mid-point level.