DOLLAR - MARATHON RALLY AGAINST MAJORS
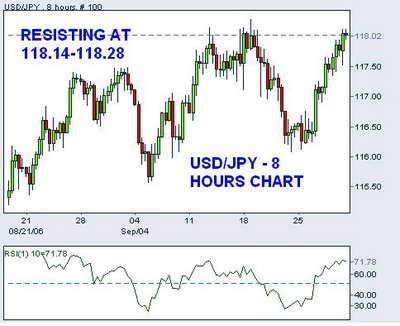
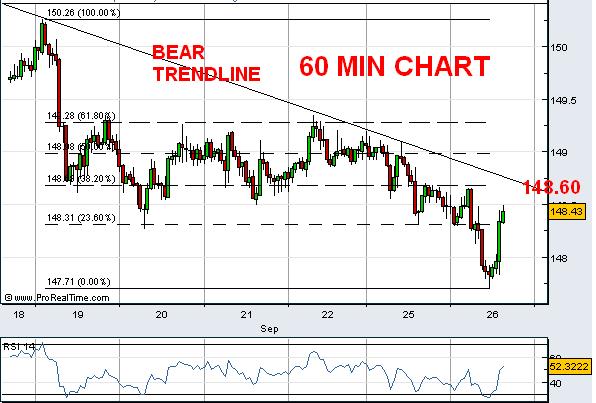
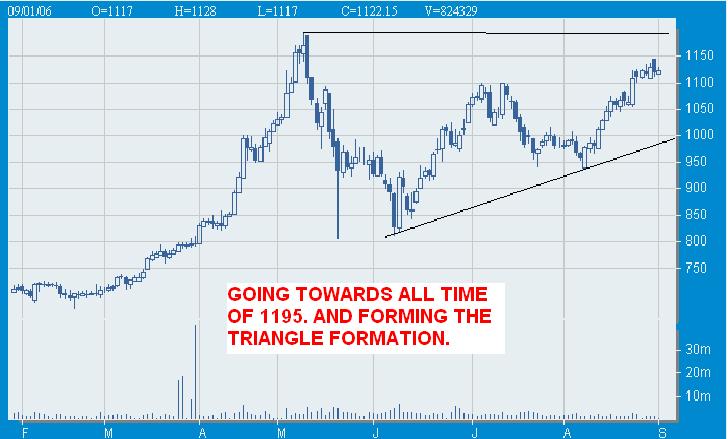
USD/JPY (118.02)
Once again back to test the heavy resistence of 118.14-118.28. Strong support is at 117.50 on 8 hours charts. Break above 118.14-118.28 it move to resist the 118.80 which conects to the8 year bear trendline. 8 hours RSI is at overbought region. Before it cross above the 118.14-118.28 it might retest the 117.50 and then make a large move.
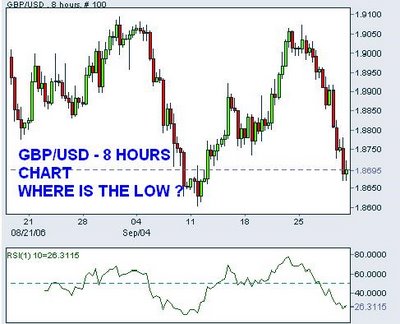
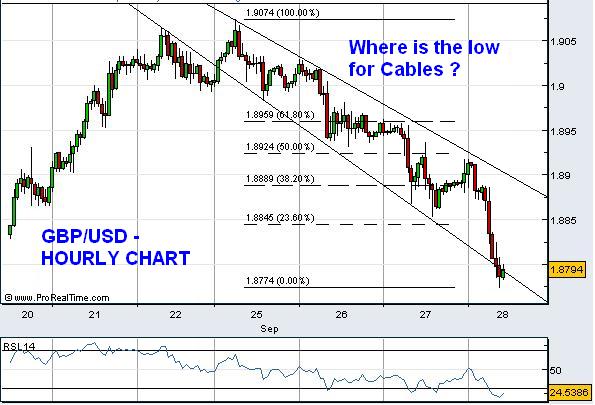
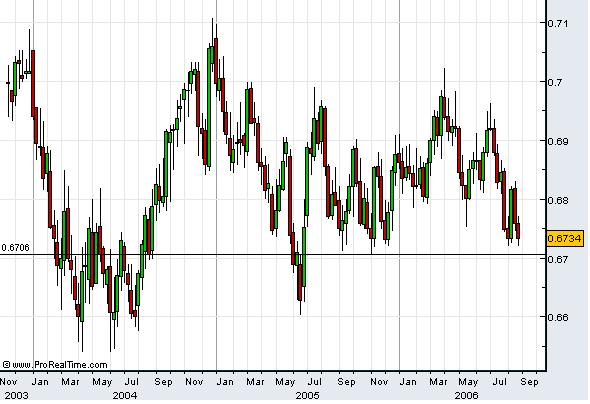
GBP/USD (1.8695)
Really Dollar giving great smack on Sterling. Still struggling to find the Bottom. As of now it made the bottoms at 1.8667. The question is how long that bottom will hold the Sterling. If that breaks then 1.8602 is on the cards. 8 Hours RSI is at extremly oversold region. Stiff resistence comes at 1.8780
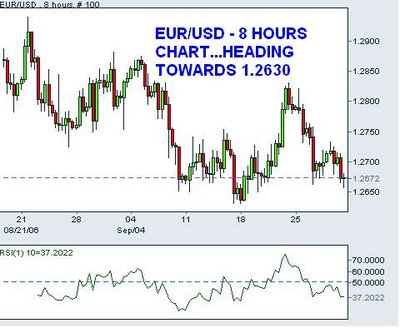
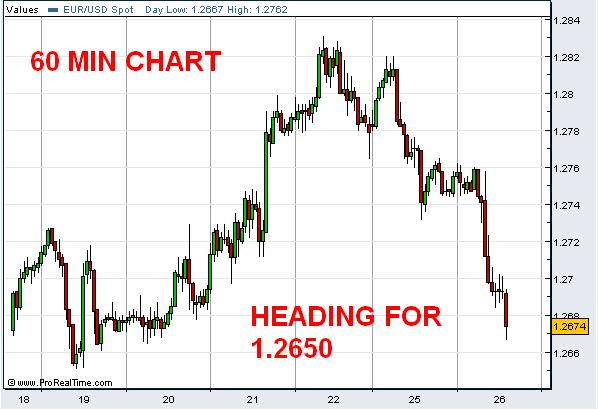
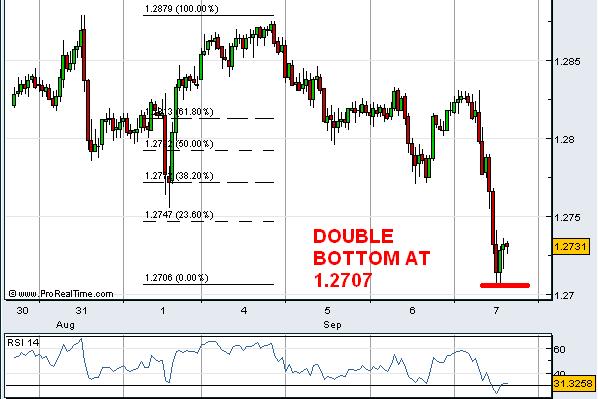
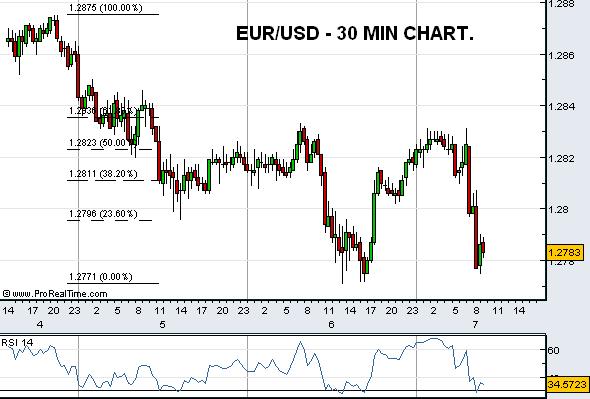
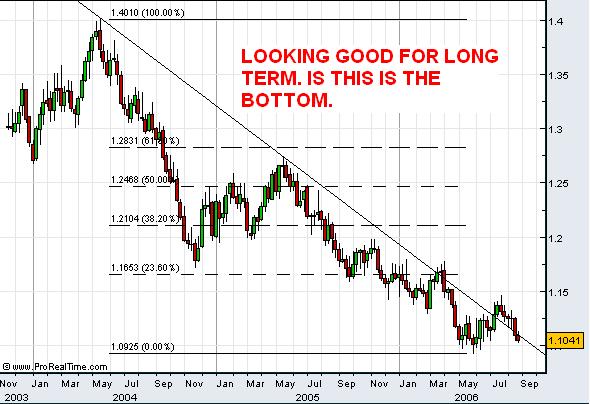
EUR/USD (1.2672)
Slowly headig towards heavy support of 1.2630. Dollar gained stronger on EUR from 1.2830. 8 hours RSI is at oversold region. This pair will make a bottom at 1.2630 and then might take some sort of retrace.
Slowly headig towards heavy support of 1.2630. Dollar gained stronger on EUR from 1.2830. 8 hours RSI is at oversold region. This pair will make a bottom at 1.2630 and then might take some sort of retrace.

USD/JPY (118.02)
Once again back to test the heavy resistence of 118.14-118.28. Strong support is at 117.50 on 8 hours charts. Break above 118.14-118.28 it move to resist the 118.80 which conects to the8 year bear trendline. 8 hours RSI is at overbought region. Before it cross above the 118.14-118.28 it might retest the 117.50 and then make a large move.

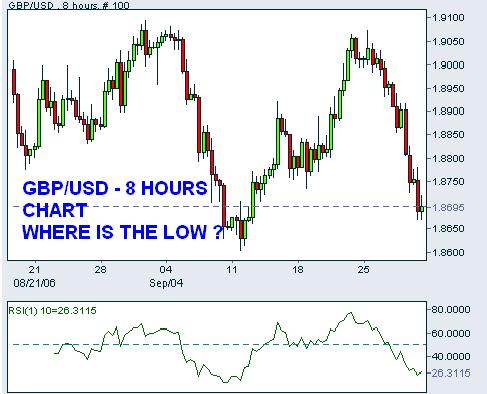
GBP/USD (1.8695)
Really Dollar giving great smack on Sterling. Still struggling to find the Bottom. As of now it made the bottoms at 1.8667. The question is how long that bottom will hold the Sterling. If that breaks then 1.8602 is on the cards. 8 Hours RSI is at extremly oversold region. Stiff resistence comes at 1.8780
posted by Naveen Pantera at 3:07 PM
![]()
![]()


